Visualization of Spatial Modulation and Persistent Response States of Strongly-driven Membrane Resonators
INC COLLOQUIUM – OFFICIAL ANNOUNCEMENT

Title: Visualization of Spatial Modulation and Persistent Response States of Strongly-driven Membrane Resonators.
When: Monday, March 25, (2019), 12:30.
Place: Sala de Conferencias, Módulo 00, Facultad de Ciencias, Universidad Autónoma de Madrid.
Speaker: Elke Scheer, Department of Physics, University of Konstanz, 78457 Konstanz, Germany.
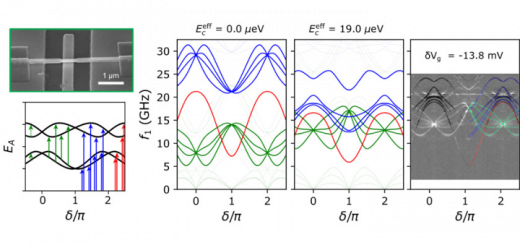
Micro- and nano-scale mechanical resonators operated in the nonlinear regime exhibit unusual dynamic behavior, e.g. the phenomenon of persistent response, which denotes the development of a vibrating state with nearly constant and high amplitude over a wide frequency range, see Fig. 1 left. So far, the requirements and the underlying mechanism to obtain the persistent response state have been unclear, mainly because of the difficulties to characterize this complex vibrational state experimentally. Here we present a method based on optical interferometry to directly image the vibrational state of membrane resonators. We show that upon increasing the driving strength the membrane first adopts a deflection pattern determined by localized, ring-shaped overtones of the driven mode (Fig. 1 middle) and that we denote as spatial modulation. At even larger driving strength, the persistent response arises as a signature of mode coupling between different flexural modes and their localized overtones, see Fig. 1 right.
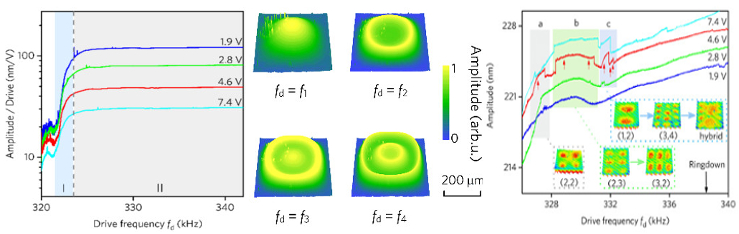
Figure 1. Persistent response and spatial modulation: Left, four nonlinear resonance curves generated by different excitation voltages showing the mean amplitude response averaged over the whole membrane area. Two distinct frequency ranges are separated by a dashed line and are marked as I and II. Middle: Four examples of spatial deflection patterns observed at different driving frequencies fd in range I associated with the spatial overtones of the ground mode mode. Right: Zoom into range II. The amplitude forms a plateau, but reveals small steps and kinks in the saturated area, some of them being marked by colored areas. In these areas the evo¬lution of different mode patterns is captured. The red arrows indicate the position where the deflection patterns were captured.
We propose a phase diagram for the manifold vibrational states that the membrane can adopt and a model based on the coupling of nonlinear oscillators that qualitatively describes the experimental observations.